The beautiful thing about education marketing is that we get to learn from our efforts as we repeat our marketing cycle each year. Our annual marketing calendars allow us to continuously improve based on data from the previous year. The key to our success is looking at the RIGHT data so that we can accurately assess our efforts and adjust for the following campaign or year.
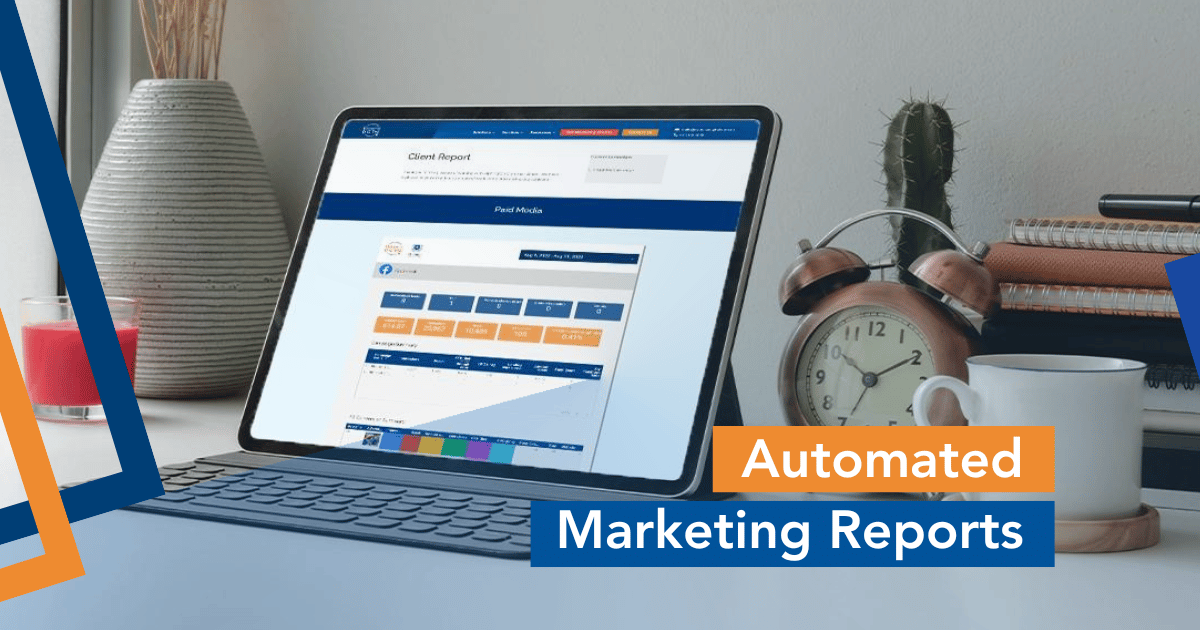
Having a marketing reporting dashboard that can pull data from various sources to give you a single view of how your marketing and enrolments activities are working across the board, is an essential tool for your success. While a reporting dashboard is an amazing tool, the data can get overwhelming. This article attempts to break down how often you should be looking at your data and what data you should be focusing on.
Reporting timelines
When setting up our dashboards, the first thing we will need to get our heads around is the timeline of our reporting. Some reports will be reviewed by leadership on an annual basis, while other reports will help us make quick adjustments as we go on a weekly basis.
The key to getting our timelines correct is that we always want to tie in our reporting cycle with our working cycle. Meaning that your reporting directly influences what you are working on. If you have a monthly team meeting, make sure your team has the numbers in front of them to make decisions at that meeting. Also, we never want to run a marketing campaign and then find out at the end of the year that it was ineffective. Rather, we want the data to enable any adjustments needed on the go. To effectively help us inform our decisions, I generally recommend the following timelines as a guide:
- Data that helps us to inform our overall strategy and marketing spend should be looked at once a year during our planning process.
- Data on current campaigns should be reviewed weekly so that any campaign adjustments can be made promptly.
- Data on the enrolments process should be reviewed monthly and annually to allow for adjustments throughout the year and to give you an aggregated view of your success.
- Website and SEO data should be looked at monthly so that your website can be improved every month.
The key to using a dashboard effectively is to tie in the data review to your working cycle and to have team members accountable for the numbers and bringing ideas to the table. This is the best way that we can ensure that the numbers influence our work.
Which numbers should I look at?
Once we get our hands on the data, it can be overwhelming at first and we can get lost in the numbers. We can spend hours sifting through data and then move on with it having little impact on what we do. To help clear the haze, I have given you a few focus areas we should routinely look at.
Know how many people are moving through your enrolments funnel
How many people submitted an initial enquiry, booked a school tour and then applied? It is important to address any bottlenecks in this process. It is important to look at this data monthly but to realise that a monthly view of this data is incomplete, so also review this data as a running total over the year.
Measuring your marketing campaigns
When running promotional campaigns we must allow enough time to adjust the campaign as we gauge its success. We will often start our campaigns two weeks earlier so that we can make space for learning and adjustments.
In terms of digital pay-per-click campaigns, the key numbers that will inform your decisions are:
- Reach – How many unique individuals are being served your ads?
- Link click through rate – How many people are clicking on your ads through to your landing page?
- Landing page conversion rate – The percentage of people converting to your action of choice once they have visited the landing page.
- Frequency – The number of times your audience is seeing your ad during a specific time period. This is important to prevent ‘ad fatigue’.
Even though we cannot tweak our traditional campaigns after they are launched, it is important to measure their overall success so that we can make informed advertising decisions. I break down different ways you can measure your traditional marketing in this article.
Your website and SEO performance
Your website plays a central role in our school’s marketing success. We often see people underestimate the impact that a great landing page can have on a campaign. When looking at the data, we want to know that we are growing the audience that visits our website each month, and that the audience is relevant to our offering and a part of our target market. To do this we will need to look at the following numbers:
- Monthly visitors (users) – This will give you an overall view of your website’s ability to drive traffic.
- New users – The number of people that visited your website for the first time. This gives you a good indication of whether you are growing your brand awareness or whether your website is just being used by current families.
- Bounce rate – The bounce rate counts the number of people that visit your website and leave before taking any other action. A high bounce rate is indicative that your website is being found for irrelevant keyword searches and that it is not reaching the right audiences. We want to aim for a bounce rate that is no higher than 40% as a start.
- Popular pages – Learn which content is the most popular and make this content easier to access from your home page.
- Popular landing pages – Popular landing pages are different from popular pages, in that it highlights the pages that are driving the most traffic to your site. These are the pages that people land on when they perform a specific search.
- The keywords that are driving traffic – It is important to look at the keywords that are driving traffic to your website, as well as the potential keywords you should be targeting more effectively. This data can be obtained from Google Search Console.
Social Media Engagement
There is no doubt that maintaining our school’s social media content is a major part of our role. It takes hard work to consistently update our communications. We want to be able to focus our time most effectively on the types of content that work for us. These are the numbers that will inform what content you should be posting:
- Reach – Are we expanding our reach and is our platform ‘feeding out’ our content?
- Engagement – Is our audience connecting with our content by engaging? We can look at:
- Likes and comments
- Shares
- Video views
- Clicks
- The most effective content types – compare the numbers above for the content type. Are videos more engaging than text posts?
- New Followers – Is our audience growing? Remember to invite the people who engage with your content to like your page.
- Popular posts/content – Summarise your most popular posts for the month and learn from what you did differently for them.
How can a marketing dashboard help?
Marketing dashboards give you a live view of what is happening, strengthens your marketing decision making and presents your data in a beautiful format this is easily shared with others. It takes an experienced professional to set up a data dashboard, but once it is, it will keep serving you through the years.
The Roberts Digital team would love to take you through our marketing dashboard examples so that you can explore your automatic reporting options for your school. Submit an enquiry below if you would like to find out more.
Questions regarding this article? Please email me at mara@robertsdigital.com.au


